Visualizing Gene Program Embeddings
This tutorial demonstrates how to visualize Tripso embeddings. We’ll explore both:
Gene Program (GP) embeddings - gene program-specific representations that capture specialized biological processes
Global cell embeddings - representations of entire cells in the learned latent space (though this is not the main focus of tripso)
Prerequisites
Completed model training (see previous tutorials)
Embeddings generated and saved in
output_global/embeddings/
from datasets import load_from_disk, concatenate_datasets
import scanpy as sc
import anndata as ad
import numpy as np
2. Load pre-computed embeddings and convert to AnnData
The model generates embeddings during inference for train, validation, and test sets. Each embedding dataset contains:
cell_token: Global cell representation (learned by the model’s global attention mechanism)<GP name>: Gene program-specific embeddings for each gene program<GP_name>_prop_genes: Proportion of total GP genes expressed in each cellMetadata:
idx, (unique cell barcode)cell_type,tissue, etc.
Note: For this tutorial, we use only the test set for simplicity. In a full analysis, you may want to concatenate all splits to avoid losing rare populations.
# Option 1: Load all data splits (commented out for tutorial simplicity)
# train = load_from_disk("output_global/embeddings/train_set")
# val = load_from_disk("output_global/embeddings/val_set")
# test = load_from_disk("output_global/embeddings/test_set")
# data = concatenate_datasets([train, val, test])

# Option 2: Load only test set for faster tutorial execution
data = load_from_disk("output_global/embeddings/test_set")
data
Dataset({
    features: ['GP_USF1', 'GP_USF1_num_genes', 'GP_NFE2L2', 'GP_NFE2L2_num_genes', 'GP_RUNX1', 'GP_RUNX1_num_genes', 'GP_FOXO3', 'GP_FOXO3_num_genes', 'GP_MYB', 'GP_MYB_num_genes', 'GP_E2F4', 'GP_E2F4_num_genes', 'GP_IRF1', 'GP_IRF1_num_genes', 'GP_GATA1', 'GP_GATA1_num_genes', 'GP_CTCF', 'GP_CTCF_num_genes', 'GP_MYCN', 'GP_MYCN_num_genes', 'GP_ATF4', 'GP_ATF4_num_genes', 'GP_ATF3', 'GP_ATF3_num_genes', 'GP_JUNB', 'GP_JUNB_num_genes', 'GP_JUND', 'GP_JUND_num_genes', 'GP_GATA2', 'GP_GATA2_num_genes', 'GP_DDIT3', 'GP_DDIT3_num_genes', 'GP_TAL1', 'GP_TAL1_num_genes', 'GP_FLI1', 'GP_FLI1_num_genes', 'GP_ELF1', 'GP_ELF1_num_genes', 'GP_RUNX3', 'GP_RUNX3_num_genes', 'GP_KLF2', 'GP_KLF2_num_genes', 'GP_PRDM1', 'GP_PRDM1_num_genes', 'GP_IRF2', 'GP_IRF2_num_genes', 'GP_NFYB', 'GP_NFYB_num_genes', 'GP_ZBTB7A', 'GP_ZBTB7A_num_genes', 'gene_encoder_cls', 'cell_token', 'length', 'AuthorCellType', 'AuthorCellType_Broad', 'cell_type', 'Sorting', 'Study', 'donor', 'sex', 'development_stage', 'age_group', 'n_counts', 'idx', 'batch_key', 'cell_type_id', 'age_group_id', 'batch_key_id'],
    num_rows: 26317
})
Create AnnData Object from Global Embeddings
Convert the HuggingFace dataset to Scanpy’s AnnData format:
X: The global cell embeddings (high-dimensional vectors)obs: Cell metadata including cell type and tissue annotations
3. Visualize Gene Program-Specific Embeddings
We first explore gene program (GP) embeddings, which is the main novelty of the Tripso model.
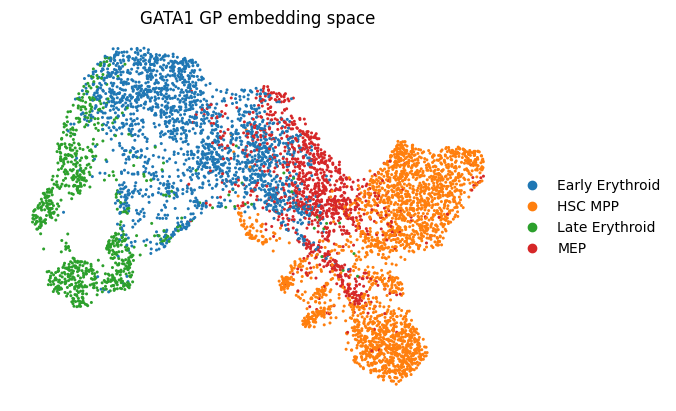
Example: GATA1 Gene Program
GATA1 is a master transcription factor for erythroid (red blood cell) development. Therefore we expect the GATA1 embedding space to capture different cell states in erythroid differentiaiton.
# Create AnnData object using GATA1 gene program embeddings in slot X
gata1 = sc.AnnData(
    X=np.array(data["GP_GATA1"]),  # GATA1-specific cell representations
    obs=data.select_columns(['idx', 'AuthorCellType', 'AuthorCellType_Broad', 'cell_type', 'age_group', 'Study', ]).to_pandas()
)
/software/cellgen/team292/mm58/venvs/lightning2/lib/python3.10/site-packages/anndata/_core/aligned_df.py:68: ImplicitModificationWarning: Transforming to str index.
  warnings.warn("Transforming to str index.", ImplicitModificationWarning)
# Subset to erythroid lineage cell types
# These represent the developmental trajectory where GATA1 is most relevant
gata1 = gata1[
    gata1.obs['AuthorCellType_Broad'].isin(['HSC MPP',
                                 'MEP',
                                 'Early Erythroid',
                                 'Late Erythroid',
                                ])
]
# Compute UMAP on GATA1 GP embedding space
sc.pp.neighbors(gata1)
sc.tl.umap(gata1)
/software/cellgen/team292/mm58/venvs/lightning2/lib/python3.10/site-packages/scanpy/tools/_utils.py:41: UserWarning: You’re trying to run this on 256 dimensions of `.X`, if you really want this, set `use_rep='X'`.
         Falling back to preprocessing with `sc.pp.pca` and default params.
  warnings.warn(
# Visualize GATA1 GP embedding colored by cell type
# Here the cells cluster according to their differentiation stage
sc.pl.umap(gata1, color=['AuthorCellType_Broad'], title='GATA1 GP embedding space', frameon=False)