Calculating Gene Program (GP) Importance Scores
This tutorial demonstrates how to calculate and analyze Tripso Gene Program (GP) importance scores from the GPLearner model. GP importance scores quantify how much each gene program contributes to a cell’s identity, enabling:
What are GP Importance Scores?
GP importance scores are computed using an ablation approach:
The model is run with each gene program individually masked/removed
We compute the cosine similarity between perturbed cell representation (output of the model with the masked GP) and the original cell representation.
The output is (1 - cosine similarity with control cell) such that higher scores = more critical for the cell representation
Prerequisites
Completed model training with GP ablation enabled (see training tutorials)
Ablation results saved in
output_global/ablation/with_gp_ablation/
import scanpy as sc
import anndata as ad
import numpy as np
import pandas as pd
import matplotlib.pyplot as plt
import seaborn as sns
2. Load GP Importance Scores
The ablation analysis generates AnnData objects where:
Cells (observations): Individual cells from your dataset
Variables (features): Gene programs (e.g.,
GP_GATA1,GP_LMO2, etc.)Data matrix (X): GP importance scores for each cell-GP.
Data Loading Options
Option 1 (Recommended for publication): Combine multiple training runs
Train model 3 times with different random seeds
Average GP importance scores across runs. While patterns across runs are broadly consistentt, this increaases robustness and reduces noise from stochastic training effects
(this was the approach for the original Tripso manuscript)
Option 2 (Tutorial): Single run for simplicity
Faster to execute
Suitable for exploratory analysis
# Load GP importance scores from ablation analysis
# The ablation process masks each GP and measures reconstruction loss change

# # Option 1: Load and combine all data splits
# train = sc.read_h5ad('output_global/ablation/with_gp_ablation/train_set.h5ad')
# val = sc.read_h5ad('output_global/ablation/with_gp_ablation/val_set.h5ad')
# test = sc.read_h5ad('output_global/ablation/with_gp_ablation/test_set.h5ad')
# adata = ad.concat([train, val, test])

# Option 2: Load only test set for faster tutorial execution (commented out)
adata = sc.read_h5ad('output_global/ablation/with_gp_ablation/test_set.h5ad')

adata
/software/cellgen/team292/mm58/venvs/lightning2/lib/python3.10/site-packages/anndata/_core/anndata.py:1754: UserWarning: Observation names are not unique. To make them unique, call `.obs_names_make_unique`.
  utils.warn_names_duplicates("obs")
AnnData object with n_obs × n_vars = 26317 × 25
    obs: 'length', 'AuthorCellType', 'AuthorCellType_Broad', 'cell_type', 'Sorting', 'Study', 'donor', 'sex', 'development_stage', 'age_group', 'n_counts', 'idx', 'batch_key', 'cell_type_id', 'age_group_id', 'batch_key_id'
3. Case Study: Dendritic Cell Subtypes
Dendritic cells (DCs) are immune cells with distinct subtypes that have different functional roles:
pDC (plasmacytoid DC): Specialize in antiviral responses, produce type I interferon
cDC1 (conventional DC type 1): Cross-present antigens, activate CD8+ T cells
cDC2 (conventional DC type 2): Present antigens to CD4+ T cells, Th2 responses
Goal: Identify which gene programs distinguish these functionally distinct DC subtypes. In the next steps, we will look at which genes drive these differences.
3.1 Filter to Dendritic Cell Subtypes
# Subset to three dendritic cell subtypes for differential analysis
dc = adata[
    adata.obs['AuthorCellType_Broad'].isin(['pDC',    # Plasmacytoid dendritic cells
                                 'cDC',   # Conventional dendritic cell
                                 ])
]
dc
View of AnnData object with n_obs × n_vars = 1704 × 25
    obs: 'length', 'AuthorCellType', 'AuthorCellType_Broad', 'cell_type', 'Sorting', 'Study', 'donor', 'sex', 'development_stage', 'age_group', 'n_counts', 'idx', 'batch_key', 'cell_type_id', 'age_group_id', 'batch_key_id'
4. Differential GP Analysis
Now we perform differential gene program analysis - analogous to differential gene expression (DGE), but at the gene program level.
4.1 Rank Gene Programs by Cell Type
We use Scanpy’s rank_genes_groups function, which:
Treats GP importance scores like gene expression values
For each cell type, identifies significantly enriched/depleted GPs
Uses statistical tests (default: t-test with overestimation correction)
Returns ranked lists with log fold changes and p-values
Since the data matrix contains GP importance scores (not gene expression), this identifies GPs that are differentially important across cell types.
# Perform differential GP analysis across dendritic cell subtypes
# This identifies which GPs are significantly more/less important in each subtype
sc.tl.rank_genes_groups(
    dc,
    groupby='AuthorCellType_Broad',  # Compare GP importance across cell types
)
/software/cellgen/team292/mm58/venvs/lightning2/lib/python3.10/site-packages/scanpy/tools/_rank_genes_groups.py:645: ImplicitModificationWarning: Trying to modify attribute `._uns` of view, initializing view as actual.
  adata.uns[key_added] = {}
/software/cellgen/team292/mm58/venvs/lightning2/lib/python3.10/site-packages/anndata/_core/anndata.py:1754: UserWarning: Observation names are not unique. To make them unique, call `.obs_names_make_unique`.
  utils.warn_names_duplicates("obs")
/software/cellgen/team292/mm58/venvs/lightning2/lib/python3.10/site-packages/anndata/_core/anndata.py:1754: UserWarning: Observation names are not unique. To make them unique, call `.obs_names_make_unique`.
  utils.warn_names_duplicates("obs")
4.2 Extract Results for pDC
Retrieve the ranked list of GPs for plasmacytoid dendritic cells.
Interpretation:
Positive logfoldchanges: GPs more important in cDC1 vs. other DC types
Negative logfoldchanges: GPs less important in cDC1
pvals_adj < 0.05: Statistically significant differences
# Get differential GP results for cDC1
pdc = sc.get.rank_genes_groups_df(dc, group='pDC')

# Show top GPs enriched in cDC1 (positive log fold change, significant)
pdc.head()
| names | scores | logfoldchanges | pvals | pvals_adj | |
|---|---|---|---|---|---|
| 0 | GP_TAL1 | 10.450618 | 0.681092 | 1.619845e-24 | 1.349871e-23 |
| 1 | GP_KLF2 | 9.903563 | 1.080405 | 3.133774e-22 | 1.566887e-21 |
| 2 | GP_GATA1 | 9.898601 | 0.363505 | 1.696406e-22 | 1.060254e-21 |
| 3 | GP_IRF1 | 8.198027 | 0.257220 | 4.826885e-16 | 1.723888e-15 |
| 4 | GP_IRF2 | 7.918591 | 1.970680 | 5.059151e-15 | 1.580985e-14 |
4.3 Extract Results for cDC
# Get differential GP results for cDC2
cdc = sc.get.rank_genes_groups_df(dc, group='cDC')

# Display top results
cdc.sort_values(by = 'logfoldchanges', ascending = False).head()
| names | scores | logfoldchanges | pvals | pvals_adj | |
|---|---|---|---|---|---|
| 0 | GP_FOXO3 | 14.252753 | 3.728169 | 1.554398e-41 | 3.885994e-40 |
| 3 | GP_ATF4 | 6.225962 | 1.933915 | 7.386285e-10 | 1.678701e-09 |
| 4 | GP_JUNB | 5.841273 | 1.342999 | 6.925215e-09 | 1.331772e-08 |
| 9 | GP_NFYB | 1.489372 | 0.845979 | 1.365762e-01 | 1.484524e-01 |
| 6 | GP_FLI1 | 4.539543 | 0.830437 | 6.046568e-06 | 1.007761e-05 |
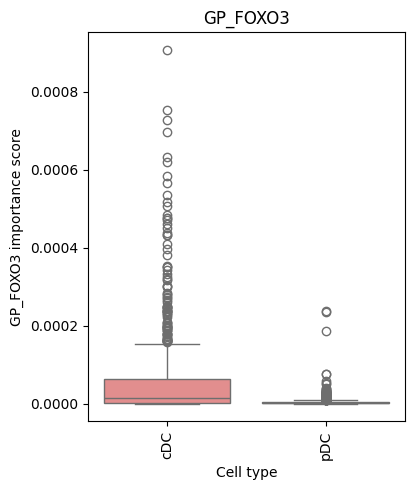
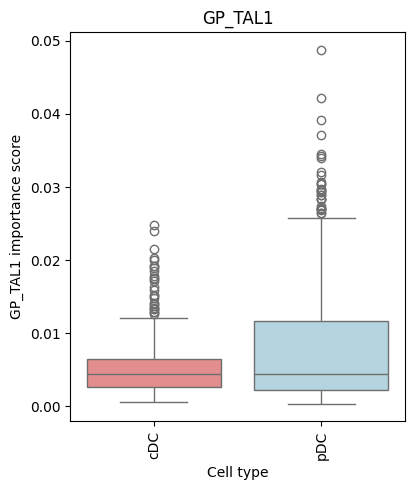
5. Visualize GP Importance Distributions
To better understand how GP importance varies across cell types, we create box plots showing the distribution of importance scores.
def make_barplot(pert_data, gp, fig_size=(5, 5), save=None):
    """
    Create box plot showing GP importance score distribution across cell types.

    Parameters:
    -----------
    pert_data : AnnData
        Data containing GP importance scores and cell type annotations
    gp : str
        Gene program name (e.g., 'GP_GATA1')
    fig_size : tuple
        Figure dimensions (width, height)
    save : str, optional
        File path to save figure
    """
    # Color palette (may need customization based on your cell types)
    colors = [
        'lightcoral',   # Color for second cell type
        'lightblue',    # Color for third cell type
        'navy',         # Color for fourth cell type (if applicable)
    ]

    # Extract GP importance scores and add to observations for plotting
    # This converts the GP column from the data matrix to a metadata column
    pert_data.obs[gp] = pert_data[:, pert_data.var.index == gp].X.toarray().flatten()

    # Create box plot
    plt.figure(figsize=fig_size)
    ax = sns.boxplot(
        data=pert_data.obs,
        y=gp,                                           # GP importance on y-axis
        x="AuthorCellType_Broad",                                  # Cell types on x-axis
        order=pert_data.obs['AuthorCellType_Broad'].cat.categories, # Preserve categorical order
        palette=colors
    )

    # Formatting
    plt.xticks(rotation=90)
    plt.xlabel("Cell type")
    plt.ylabel(f"{gp} importance score")
    plt.title(gp)
    plt.tight_layout(rect=[0, 0, 0.85, 1])

    if save:
        plt.savefig(save)

    plt.show()
# Visualize GP importance distributions for example gene programs
# These GPs were selected based on known roles in hematopoiesis
for gp in ['GP_TAL1', 'GP_FOXO3']:
    make_barplot(dc, gp)
/tmp/ipykernel_1310618/1647168921.py:29: FutureWarning:

Passing `palette` without assigning `hue` is deprecated and will be removed in v0.14.0. Assign the `x` variable to `hue` and set `legend=False` for the same effect.

  ax = sns.boxplot(
/tmp/ipykernel_1310618/1647168921.py:29: UserWarning: The palette list has more values (3) than needed (2), which may not be intended.
  ax = sns.boxplot(